- Home
- TickCheck Data
Our Tick Testing Data
Each tick submitted for testing contributes to the research being conducted here at TickCheck. By keeping records of all the results generated, we have been able to gain valuable insights into disease prevalence and co-infection rates. The comprehensive testing panel has been especially helpful in contributing to this research by ensuring all diseases and coinfections are accounted for when examining a tick. Our current research shows that 42% of tick tested are infected with at least one pathogen, 30% are co-infected with two or more, 8% carry three or more, and 3% of the ticks tested carry four or more.
Infection Visualization by Tick Species
All Ticks Tested
42% Positive for Infection
Negative (58%)
49% Positive for Infection
Negative (51%)
56% Positive for Infection
Negative (44%)
15% Positive for Infection
Negative (85%)
Coinfection Visualization
4+ Coinfection (3%)
3+ Coinfection (8%)
2+ Coinfection (30%)
No Co-infection (70%)
Pathogenic Prevalence by Species & Life Stage
Generally, nymphal ticks will have fewer pathogen because they've had fewer opportunities to feed. Our data shows this as well.
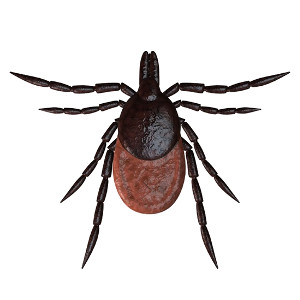
Infection Rate for Borrelia burgdorferi between Adult Female and Nymphal Deer Ticks
Nymphal Deer Ticks
Sample size of 3,826 ticks.
23% Positive
77% Negative
Adult Female Deer Ticks
Sample size of 9,387 ticks.
36% Positive
64% Negative
Infection Rate for Anaplasma phagocytophilum between Adult Female and Nymphal Deer Ticks
Nymphal Deer Ticks
Sample size of 3,502 ticks.
Adult Female Deer Ticks
Sample size of 8,976 ticks.
10% Positive
90% Negative
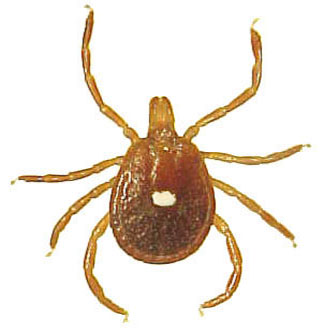
Infection Rate for Rickettsia amblyommii between Adult Female and Nymphal Lone Star Ticks
Nymphal Lone Star Ticks
Sample size of 1,084 ticks.
49% Positive
51% Negative
Adult Female Lone Star Ticks
Sample size of 385 ticks.
50% Positive
50% Negative
Pathogenic Prevalence in Florida
The bars below show the positive/negative prevalence ratio of selected pathogens we test for.
These pathogens were observed in ticks from Florida.
Data set includes tests performed since TickCheck's founding in 2014 and is updated in real time.
Borrelia burgdorferi
(deer tick) associated with Lyme disease
Sample size of 92 ticks.
11% Positive
89% Negative
Borrelia burgdorferi
(lone star tick) associated with Lyme disease
Sample size of 245 ticks.
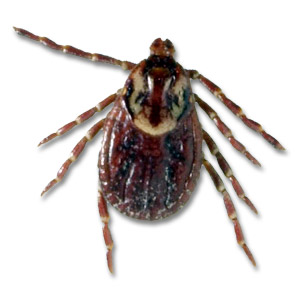
Borrelia burgdorferi
(American dog tick) associated with Lyme disease
Sample size of 47 ticks.
Warning: Low Sample Size
0% Positive
100% Negative
Anaplasma phagocytophilum
associated with anaplasmosis
Sample size of 230 ticks.
Babesia microti
associated with babesiosis
Sample size of 118 ticks.
Bartonella spp.
associated with bartonellosis
Sample size of 144 ticks.
Ehrlichia chaffeensis
associated with ehrlichiosis
Sample size of 300 ticks.
Rickettsia spp.
associated with Rocky Mountain spotted fever
Sample size of 134 ticks.
48% Positive
52% Negative
Francisella tularensis
associated with tularemia
Sample size of 227 ticks.
0% Positive
100% Negative
Borrelia miyamotoi
associated with B. miyamotoi
Sample size of 147 ticks.
Borrelia lonestari
associated with STARI
Sample size of 158 ticks.
Babesia spp.
associated with babesiosis
Sample size of 71 ticks.
Bartonella henselae
associated with cat-scratch fever
Sample size of 30 ticks.
Warning: Low Sample Size
0% Positive
100% Negative
Mycoplasma spp.
associated with Mycoplasma spp.
Sample size of 90 ticks.
Borrelia spp.
associated with Borrelia spp.
Sample size of 76 ticks.
Powassan virus General
associated with Powassan virus General
Sample size of 50 ticks.
Borrelia mayonii
associated with Lyme disease
Sample size of 63 ticks.
0% Positive
100% Negative
Ehrlichia ewingii
associated with ehrlichiosis
Sample size of 93 ticks.
Rickettsia amblyommii
associated with Rocky Mountain spotted fever
Sample size of 91 ticks.
53% Positive
47% Negative
Babesia duncani
associated with babesiosis
Sample size of 51 ticks.
0% Positive
100% Negative
Rickettsia rickettsii
associated with Rocky Mountain spotted fever
Sample size of 251 ticks.
0% Positive
100% Negative
Ehrlichia muris-like
associated with ehrlichiosis
Sample size of 51 ticks.
0% Positive
100% Negative
Ehrlichia spp.
associated with Ehrlichia spp.
Sample size of 48 ticks.
Warning: Low Sample Size
0% Positive
100% Negative
Anaplasma spp.
associated with Anaplasma spp.
Sample size of 48 ticks.
Warning: Low Sample Size
0% Positive
100% Negative
Babesia odocoilei
associated with Babesia odocoilei
Sample size of 30 ticks.
Warning: Low Sample Size
0% Positive
100% Negative
Ehrlichia canis
associated with Ehrlichia canis
Sample size of 30 ticks.
Warning: Low Sample Size
0% Positive
100% Negative
Panola Mountain Ehrlichia
associated with Panola Mountain Ehrlichia
Sample size of 30 ticks.
Warning: Low Sample Size
0% Positive
100% Negative
Rickettsia montanensis
associated with Rickettsia montanensis
Sample size of 29 ticks.
Warning: Low Sample Size
0% Positive
100% Negative
Anaplasma phagocytophilum - Deer Variant
associated with non-human anaplasmosis
Sample size of 62 ticks.
0% Positive
100% Negative
Anaplasma phagocytophilum - Human Active
associated with anaplasmosis
Sample size of 62 ticks.
0% Positive
100% Negative
Powassan virus Lineage Ⅱ
associated with Deer Tick Virus
Sample size of 34 ticks.
Warning: Low Sample Size
0% Positive
100% Negative
Powassan virus Lineage Ⅰ
associated with Powassan virus Lineage Ⅰ
Sample size of 34 ticks.
Warning: Low Sample Size
0% Positive
100% Negative
Rickettsia parkeri
associated with Rickettsia parkeri
Sample size of 30 ticks.
Warning: Low Sample Size
0% Positive
100% Negative
Pathogen and co-infected tick prevalence data is © TickCheck, and is derived from our tick testing results and laboratory research.